blog.her.se
open-menu closeme
Home
Archives
Links icon
LinkedIn Medium
About
🌐
English
github twitter linkedin rss
  • How to visualize your nested IoT data in 3d using Spark and Power BI

    calendar Jan 9, 2021 · 10 min read · azure databricks Power BI spark nested data featured visualization  ·
    Share on: twitter facebook linkedin copy
    How to visualize your nested IoT data in 3d using Spark and Power BI

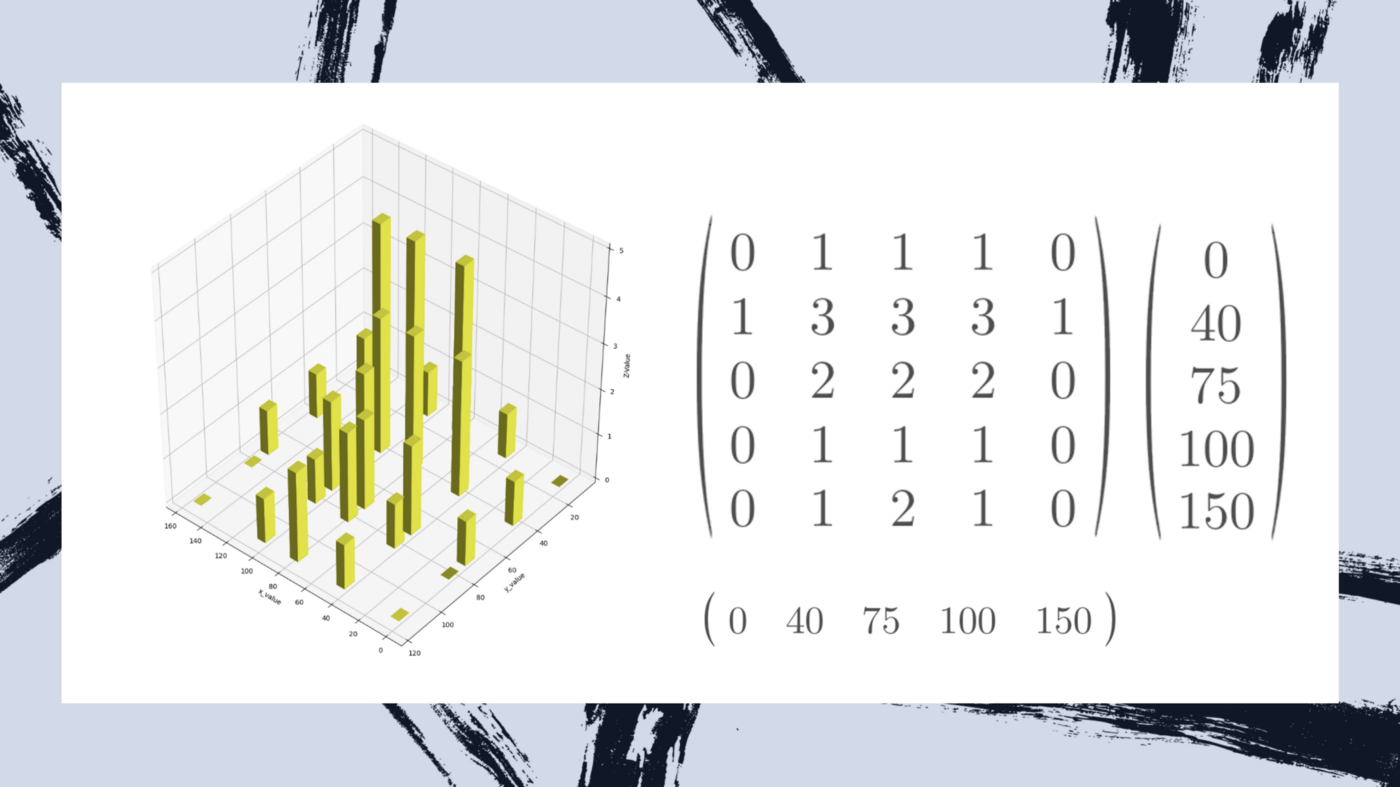
    Using Azure Databricks, Spark, Python and Power BI python script visuals Image by author A. Introduction Every now and then, you run into new unique problems to solve. This time it was a client getting nested IoT data. Storing and visualizing IoT data is usually a standard task, but getting nested IoT data as a …


    Read More

Mikael Hermansson photo

Mikael Hermansson

I use this blog as my personal online notes. If someone else can get help from my notes it's just great. I often document what I learn and that's what I share.
Read More

Featured Posts

  • Synapse Serverless SQL - Access tables and views without Storage Access
  • Shared External Hive Metastore with Azure Databricks and Synapse Spark Pools
  • How to visualize your nested IoT data in 3d using Spark and Power BI

Recent Posts

  • Azure static web apps with Hugo
  • Partition overwriting using parquet and Databricks

Categories

SYNTAX 2 THEMES 1

Series

AZURE 4 THEMES-GUIDE 2

Tags

AZURE 4 FEATURED 4 DATABRICKS 3 HUGO 2 SPARK 2 SYNAPSE 2 AAD 1 ACCESS 1 CSS 1 CUSTOM-DOMAIN 1 EMOJI 1 EXTERNAL-METASTORE 1 GITHUB 1 HIVE 1
All Tags
AAD1 ACCESS1 AZURE4 CSS1 CUSTOM-DOMAIN1 DATABRICKS3 EMOJI1 EXTERNAL-METASTORE1 FEATURED4 GITHUB1 HIVE1 HTML1 HUGO2 INDEX1 MARKDOWN1 NESTED-DATA1 OBSIDIAN1 PARQUET1 PARTITIONING1 POWER-BI1 PRIVACY1 SERVERLESS1 SHORTCODES1 SPARK2 SQL1 STATIC-WEP-APPS1 SYNAPSE2 THEMES1 VISUALIZATION1
[A~Z][0~9]
blog.her.se

Copyright  BLOG.HER.SE. All Rights Reserved

to-top